
Digital images both lie to us and tell us truths that exist outside of our normal perception. The lie comes about through both deliberate distortions and distortions produced by limitations in digital and in other reproduction methods. The limitations of reproductions are easy to see for anyone who considers the situation carefully, but understanding the problems that they create in our understanding of the past requires some study. The most coherent summary of the problems of the late 1980s and the problems with reproductions in general was written by G. T. Tanselle in 1989. In this essay, “Reproductions and Scholarship”, Tanselle reminds us that “everyone knows (though many people act as if they do not know) that every form of reproduction can lie, by providing a range of possibilities for interpretation that is different from the one offered by the original.”1 These reproductions can be useful supplements to the originals, but serious research ought to be checked against the originals to determine where the reproduction may mislead. He summarizes the obligation of those who study the verbal texts of the past,
The words that come to us from the past, transmitted by paper and ink, cannot be assumed to reflect accurately what their authors intended; in order to assess how the words that are present in documents came to be there, and indeed to try to make sure that we know what words are in fact there, we must avail ourselves of all the evidence that comes with them.2
While photocopies, photographs, and microphotographs can place texts before us that we cannot always get to ourselves, they are all several steps removed from the original and each step provides opportunities to alter—intentionally and not—the final product of the reproduction process. Taking up this line of thinking, Bonnie Mak recently wrote about the problematic assumptions in doing literary research from the digitized versions of high-contrast microfilms, created under war-time expediencies.3 Her “Archaeology of digitization” describes the context in which the familiar database of Early English Books Online was produced and how it has come to stand in for access to the original. Echoing Tanselle’s objection, she notes that the expediencies of war-time microfilming and batch digitization lead to unpredictable, but often interpretable, errors that themselves are worthy of study. Rather than bemoaning the poor state of—what is for many students and scholars distant from major libraries—the “archive of record” for English books, she claims that we can study the errors in these reproductions to understand a historical moment that sees verbal texts in a certain way. Digitization, microfilming, and OCR fail us, but we can use “paratextual” clues to determine how a particular digital reproduction came to be and so compensate for actual and potential errors, albeit incompletely.
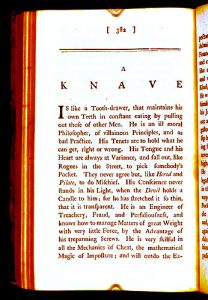
Both of these arguments anticipate specialized tools that reproduce information that would not normally be part of the experience of looking at a book, which is right, but something that I think deserves further investigation. While a high-contrast microphotograph may obscure faint ink, blue pencil, or small dots, it also shows us something that we would not normally be attentive to. Consider this photograph of page 382 from a copy of Samuel Butler’s Genuine Remains (ViU PR3338 .A17 1759 c.2 v.2),

P. 382
Our eyes immediately read the heading “A Knave” and, if you are literately minded, you—perhaps—start reading the text, wondering what a knave might be. But, let me point out the black background, the brown leather of the cover on the left, the transparent fingers holding the page down, and the show-through of the ink from the other side of the leaf in the image. If we thought that those things did not matter, we might have a good reason to alter the digital image by tweaking the colors so that the colors that do not interest us are not visible. But first, we would need to identify which colors interest us. One way of visualizing the range of colors in an image is whats called a color histogram,
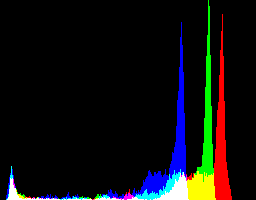
Histogram for p. 382
The peaks to the left are the dark colors of the background. The peaks to the right are the brown colors of the paper. In between those peaks, the smaller peaks represent ink, discolored paper, the restraining fingers, and other features. If we alter the image by emphasizing those colors that interest us, we destroy the paratextual evidence valued by Mak and obscure the evidence noted by Tanselle, but emphasize what interests us. If we take on the obligation of returning to the original to check our assumptions, this alteration can focus to our investigation on the facts that interest us. For example,
Ink emphasized
stretching the colors in the middle of the histogram to cover the whole range of reproducible colors eliminates information in the outer ends of the histogram, which turns out to be mostly show-through and portions of the digitization apparatus, other pages, and the binding. Quantitatively, the first image has 10,778 unique colors and the stretched image that emphasizes ink has 26,344. This means, as both Mak and Tanselle have rightly pointed out, that we have fabricated evidence by altering the image. The second image has over twice as many colors which do not occur in the original and it would be wrong to suggest that we have somehow discovered new information with the second image. In fact, we have destroyed evidence to render a digital image more useful for a particular line of investigation: examining only the fully inked bits of the page. A careful observer may also note that the image looks a bit Fauvist with artificial colors. Were I to believe that I was improving the image by altering its color range, I would have to “correct” that error by tweaking the colors further, but as this image is an artificial visualization the unnatural coloring helps to remind me and anyone else who sees this image that it is a deliberate alteration of what one would see if they looked at the book. The stumbling block in understanding the limitations of visualizations like this one is that they foreground what most people look at when they look at a book: the letters that have been deliberately and sufficiently inked and impressed on the page. If we consider a physical codex as a noisy container for works of art made of text, one can imagine—à la Claude Shannon—that this alteration restores the original text by eliminating noise. The problem with this approach is that it eliminates the opportunity to apply our judgment to the full range of evidence available, even in a limited reproduction. A book, and even the digital image of a page of a book, contains far more information than just the sequence of letter-forms that appear sufficiently on its surface. Consider the digitization process itself and what it can capture.
8-Bit Per Channel Versus 16-Bit Per Channel
Human vision can normally distinguish a bit more than sixteen-million colors, so modern digital images provide a color range that encompasses that in three channels—typically, red, green, and blue. Each pixel—that is, evenly-colored dot—in the image has three numbers associated with it that correspond with the amount of red light, green light, and blue light that must be mixed together to produce the right color on an illuminated screen. (There are many variations of this in different color spaces, CMYK is more useful for printing, Munsell is better for colorimetry; but this particular explanation is sufficient for this post.) A quick bit of math shows that eight bits gives 256 intensities to each channel (red, blue, or green) and that these three channels together give 256 times 256 times 256 colors, that is 16,777,216 different colors. Thus, it is simply a matter of calibration and choosing the right range of intensities for an eight-bit per channel image to reproduce the entire range of colors that can be seen. However, image detectors can distinguish more than this and digital photographers can use this extended range to mimic the large range of colors that can be perceived in the world. Let me explain how we can perceive more colors than we can see.
When we look at a dark alley in the sunlight, our eyes adjust the intensity of the light as our gaze passes over the scene. When we look at the clouds around the sun, our irises constrict, reducing the amount of light that enters our eye so that we can see clouds as white on blue backgrounds rather than as just bright white light. When we stare into the alleyway, our irises expand to take in more light, so that we can see the red bricks on the side rather than just a dark alley. Normally, our eyes move over a scene quickly and take in different intensities of light and our brain combines them together into one image in our mind. Based on contextual clues, we can perceive a wider range of colors than our limited sixteen-million-color vision can see because of how our eyes adjust and our intuition about how light functions in the world. (Josef Albers explains how this visual intuition is not truly a deeper knowledge about color, but an intuition that can be manipulated into seeing colors that are not really there in his pioneering Interaction of Color3) Digital detectors, as of yet, do not operate quite in this way, but can mimic the process. One way is to take several digital photographs at different brightness levels and stitch them together. In our example, we could take a too-bright photograph to capture the red brick of the alley and a too-dark photograph to capture the white and blue of the clouds. Photographers call this high-dynamic-range imaging, and it essentially extends the detection of color beyond the sixteen-million limit. As this method has existed for awhile, detectors have been built that can detect colors outside of the normal range to save the trouble of taking multiple exposures. (Thanks to Shane Lin for helping me to understand this.) The commercial purpose of these detectors is to help in high-dynamic-range photography, but the result is that they can detect sixteen-bits of information per red, blue, and green channel (or equivalent) giving 65,563 colors per channel and giving trillions (281,823,012,408,547) of possible colors. One way of considering how this extended range might improve digital reproductions, is that sixteen-million times more evidence captured. If the color of a page means something—and it certainly does since color is the way we distinguish the letter-forms that make up the text—then we have much, much more information in a sixteen-bit per channel image.
The Digital Production Team at the University of Virginia graciously provided these higher-bit-per-channel images. (A special thanks belong to Christina Deane who approved what must have seemed like a plan hatched by the Mad Hatter and Sam Pierceall who joined the tea party and helped us to understand his workflow—and possibilities for digitization using his equipment.) Looking back at the histogram earlier in the article, you can see that the broadest peaks fall on the right. These correspond to the brownish color of the paper and, in the sixteen-bit per channel images, cover a range of around eleven-million colors. These eleven-million colors fall into around ten-thousand distinguishable colors under normal circumstances. However, using a similar Fauvist-like visualization to the one above, we can uncover more information. For this experiment, we focused on a traditionally bibliographical object of study, paper.
Finding the Color Range for a Typical Image of a Piece of Paper in a Book
The first problem was to uncover the typical color of the paper in the images of the book. If you look closely at any sheet of paper, or any image of a sheet of paper, you see a range of colors. For example,
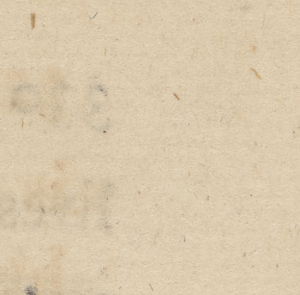
Close-up of p. 382
you can see the fragments of dark-brown wood and whitish fibers along with yellow-brown linen fibers that have a range of shades. Furthermore, since we are exploring shades of brown beyond normal human vision, we cannot assume that what appears—using human vision—to be a uniform brown paper throughout is actually uniform. We needed to find the average shade across all five-hundred and thirty images of the pages of the body of the book without relying on our eyes. Luckily, we have ImageMagick, a tool aggressively developed by a range of experimenters who work not only with sixteen-bit per channel color, but even higher and stranger bit depths. After recompiling the tool to work with higher bit-per-channel images, we could create a running average of every ten pages, which looks like semi-transparent pages on top of each other,
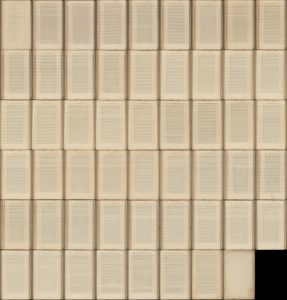
Mosaic of averages (converted to 8-bit per channel here)
This visualization—at this point no one would think that this tries to accurately reproduce the look of a book—has some interest in itself. Were we doing distant-reading, we could note that the book seems to be mostly in prose, with some footnotes, and a table of contents at the front. But, if we average these fifty-three images together (we leave, as a trivial exercise to the reader, the fact that averaging ten images at a time and then averaging all those together is equivalent to averaging all five-hundred and thirty images together, but is far less computationally intensive) we get what we are aiming at—the average of all the images of pages of our text, including the average color of the paper,
Average page
Using this, we can identify the range of colors in the images of paper from the book as a whole and stretch those eleven-million or so colors, that would normally look like only ten-thousand, across the whole range of human vision. We should be able to visualize subtle shades of brown that we could not normally see.
Arranging the Images
Altering each image with ImageMagick is a relatively simple exercise, but leaves five-hundred and thirty Fauvist-style, blue-tinted images. Some detail can be made out, such as wirelines, but these visualizations still focuses on the page as a unit of inquiry while the paper in a book is not printed by page, but by gathering. Summarizing the principles of collation is beyond the scope of this post, but for those who understand the fundamentals of descriptive bibliography, the book collates thus,
8o: A4 B-2K8 [$1-4 (-A1,3,4) signed] 260 leaves, pp. [8] [1-2] 3-512 (4=iv, 14-15=15-14, 474=74).
In other words, it is printed in octavo—that is eight pages to each side of a large sheet of paper—and folded down into gatherings of eight leaves and sixteen pages, although gathering A is slightly different. This means that we can use imposition schemes from Gaskell to recreate the layout of how the sheets of paper looked as they came off the printing press.5 Using ImageMagick to flip and arrange the digitized images (slightly cropped, so that there is not too much of the digitizing apparatus visible and leaving out the irregular A), we get,
Sheets of the Book
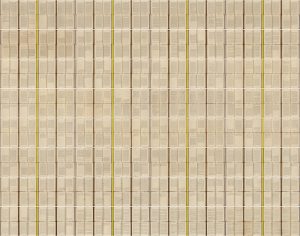
In this visualization—it cannot be a reproduction since the original sheet form of the book no-longer exists, though it might be called a “simulation” of the original form—the white lines represent the boundaries of each sheet of paper and the yellow lines the front and back of each sheet. That is, the eight pages to the left of each yellow line represent the outer forme—as identified by Gaskell—and the eight pages to the right of the yellow line represent the inner forme of the sheet. Looking at the image, things do not look promising. Each sheet of paper should be a slightly different shade of brown because many should come from separate batches: the printer would have bought paper for the whole book, but printed off each forme in sequence so that the sheet of paper produced immediately before or after any particular sheet of paper in this book is probably not in this copy. Furthermore, the finished paper coming from the paper mill may have been shuffled along the way, or at the printing shop, so even if we knew the exact sheet that was printed after a given sheet (in another copy of this book, or perhaps another book altogether, or some broadside ballad), we still would not know if it was produced in the same batch. It is likely that many of these sheets came from different batches, but there is no way of knowing because there are only subtle differences of the shade of brown to distinguish them. Yet, by stretching the color range of the paper to the whole range of human vision, we can perceive another pattern.

Visually Altered Sheets of the Book (Download the large version)
Each sheet of eight pages per side, seems to have a different shade of blue. In the upper left, you see a darker, speckled sheet. In the middle, pale blue sheets that might be the same batch. In other places, you can see brown smears across the surface of the sheet itself or brown fingerprints on the individual pages. This visualization shows some of the evidence contained in the physical copy of the book that can be captured with a higher bit-depth image. The deviation of color from the average happens over whole sheets, portions of one side of a sheet, on facing pages, or on single pages. Each of these discolorations—relative to the average color—is evidence of different sorts things that happened at different times in the history of this book.
Whole Sheet Deviation
Paper is made in vats of floating fibers that are periodically refilled with more fibers, so no two sheets are quite alike. At the end of a day of work, a vat would be left and refilled the next day, perhaps with new fibers. So, that two sheets do not have quite the same color makes sense: they have different combinations of fibers. Two sheets made one right after the other should be somewhat similar, like the sheets in the middle of this book, but sheets made by different producers, with different fibers, or on different days would likely look totally different. Thus, when we see both sides of a sheet of paper colored the same as each other, but differently colored than their neighbors, it provides evidence of the paper-making process from the vat where discoloration would be evenly distributed. It is possible that while the sheets were stored, dampness or other factors may have discolored the whole sheet, but as a physical object in the world, the source of the discoloration is more likely to come from one side or the other, and is likely to be localized to only one part of the sheet.
Portions of One Side of a Sheet Discoloration
Single-sided discolorations can be seen throughout, in some places with an apparently matching discoloration on the adjacent sheet. These suggest evidence that comes about during the sheet-phase of the book’s life. Either when it was paper being stored and transported, or newly printed sheets drying (or being stored or transported) before they were rough folded. As such, the matching brown smears on the two sheets in the middle suggest that they might have been stored one on top of the other with some moisture or other discoloring substance between them. In other cases, the discoloration may come from the unfolded or partially folded sheets being stored one on top of the other with felts between them. Another source of discoloration could be fingerprints from the papermakers, printers, or warehouse employees handling the pages before they were folded. These can be seen on the outer edges of the sheets of paper, where you would grab these if you were picking them up. Fingerprints and small marks in the middle of the sheet suggest something else.
Facing Page Discoloration
During the page-phase of the book’s life, after it was bound or rough-folded into a codex form, dirty fingers could still leave marks on pages. Marks on the edges of page units, particularly those that would have fallen in the middle of a sheet, rather than marks on the edges of sheets suggest that handling soiled them. If a substance that discolored the page was left on it, when the book was closed the substance could also transfer to the adjacent page. It follows that a mirror-image of the discoloration might be found on the facing page. Look in the lower right, a normally-visible water-stain becomes black on both facing sheets. Some of the faint smudges in the middle have even fainter smudges on the page facing them. These marks suggest things that happened to the book as it was read or handled in codex form. We can note the more heavily soiled pages as a way of suggesting—perhaps bolstered with evidence from other copies—the pages that were most read, at least by people with dirty fingers.
Single Page Discoloration
A few pages stand out as different from their neighbors, and differing from the page opposite them on the same leaf. These discolorations must have come about during the codex phase of the book’s life, but how it was isolated to one page is unclear to me. In some cases, it may merely be a smudge, or ink mark, that had time to dry and so was not transferred to a neighbor, but was not wet enough to penetrate the thin page to the opposite side. In other cases, it could be the result of an inconsistency in the digitization process (a light started to flicker, the software had a bug that altered the color differently) or image manipulation process. A more remote possibility is that the one page is somehow different—say a cancellans, a term coined by R. W. Chapman to name the replacement sheet inserted in a book to correct an error or add to a text6—but that it is glued to an original page. Or, the page could be a full cancellans from a stock of paper that was stored differently and was discolored then. Lastly, it could be soiling from a time when the book was stored as rough-folded gatherings. In any of these cases, I think of Tanselle’s suggestion to check the reproduction “against the original”7 when proof-reading. This check becomes particularly crucial here because our visualization is artificially colored and does not even attempt to try to realistically reproduce the characteristics of the original object. The pages are not blue, so these images do not reproduce these pages and the artifact itself may provide more insight. These single page discolorations suggest that further research into particular pages needs to be done, something that this whole exercise has already suggested.
The Importance of the Original Object
This post, I hope, demonstrates two things. First, that information about the paper in books, and how it was handled, can be partially uncovered using digital visualization techniques. While the Fauvist-like, blue-book imposition scheme is totally artificial and does not reproduce anything in the real world, it corresponds with the features of a real artifact. We can always learn more about the book as a mute witness to history by collecting and arranging detectable data. Second, I hope this post demonstrates that a digital reproduction is not only an insufficient substitute for an artifact, but that one digital reproduction is not equivalent to another. Only a few years ago, we would not have been able to produce the sixteen-bit per channel image needed for this work, yet the information was still contained in the artifact, waiting to be uncovered. Who is to say that more subtle and powerful digitization methods will not be discovered? Too often, requests for digitization are met with “it’s already in Google Books”, but I think this project shows that particular digital reproductions reproduce particular characteristics that do not encompass all the characteristics that can be captured using other digitization techniques. Multi-spectral imaging and higher-quality spectroscopy promise to generate even better visualizations, but if the pace of technical progress continues, these will just be another waypoint along the way of continuing technological improvement. Next decade’s imaging may enable visualization of information contained in original artifacts that we have not even considered, another reason to preserve the original artifact after it has been digitized and to avoid damaging materials while studying them through digitization.
While our books bear silent and eloquent witness to their own production history, technology keeps changing and tomorrow’s technology might let us know a little bit more of the history that books embody. For this project, this visualization suggests the range of evidence to be found in particular copies. Returning to the author’s manuscript, where available, or attempting to infer what the author’s manuscript must have looked like, has a great deal of value as a coherent aim for historical investigation, but—so too—has the recovery of the history of printed artifacts which first exposed readers to a composite of production processes that take an author’s manuscript, edit it, revise it, order it, format it, and impress it on paper. Studying a particular edition, while not replacing editing for authorial intention, recovers the intention of compositors and correctors who also had a say in the texts that the past left to us, and so should have a voice it recovering their history.