
One good thing about living in this age is instant access to information. What could be better than that? Maps!
The USGS has up-to-the-minute maps for earthquakes all over the world. For the latest Virginia events click here. You can find their main earthquake page here.
The USGS also has a crowd-sourced program - called Do You Feel It? - where users can gauge the quake at their location and report back to help build the map below. More on that program here.

Crowd-sourced intensity map - USGS
The good people at Development Seed created some cool maps just after the largest Virginia quake using publicly-available data and some tools from the guys at MapBox. Please click here to see how they quickly mashed up the earthquake data to make some great maps.
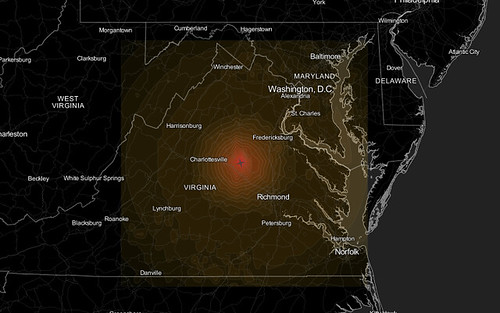
http://tiles.mapbox.com/mapbox/#!/map/map_1314132938521
Though, I think the most interesting visualization is this animated one, showing the earth rippling like a pond.
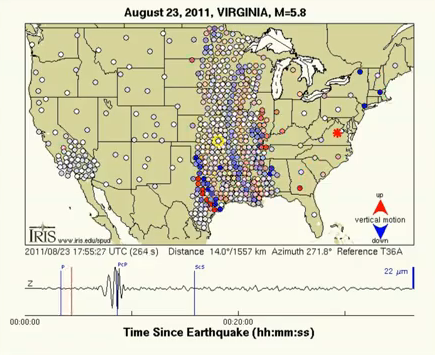
YouTube: http://www.youtube.com/watch?v=IKE7MLNdtcg