
When did I eat all those candies?
This second visualization will answer the above question, and also which candies I ate.
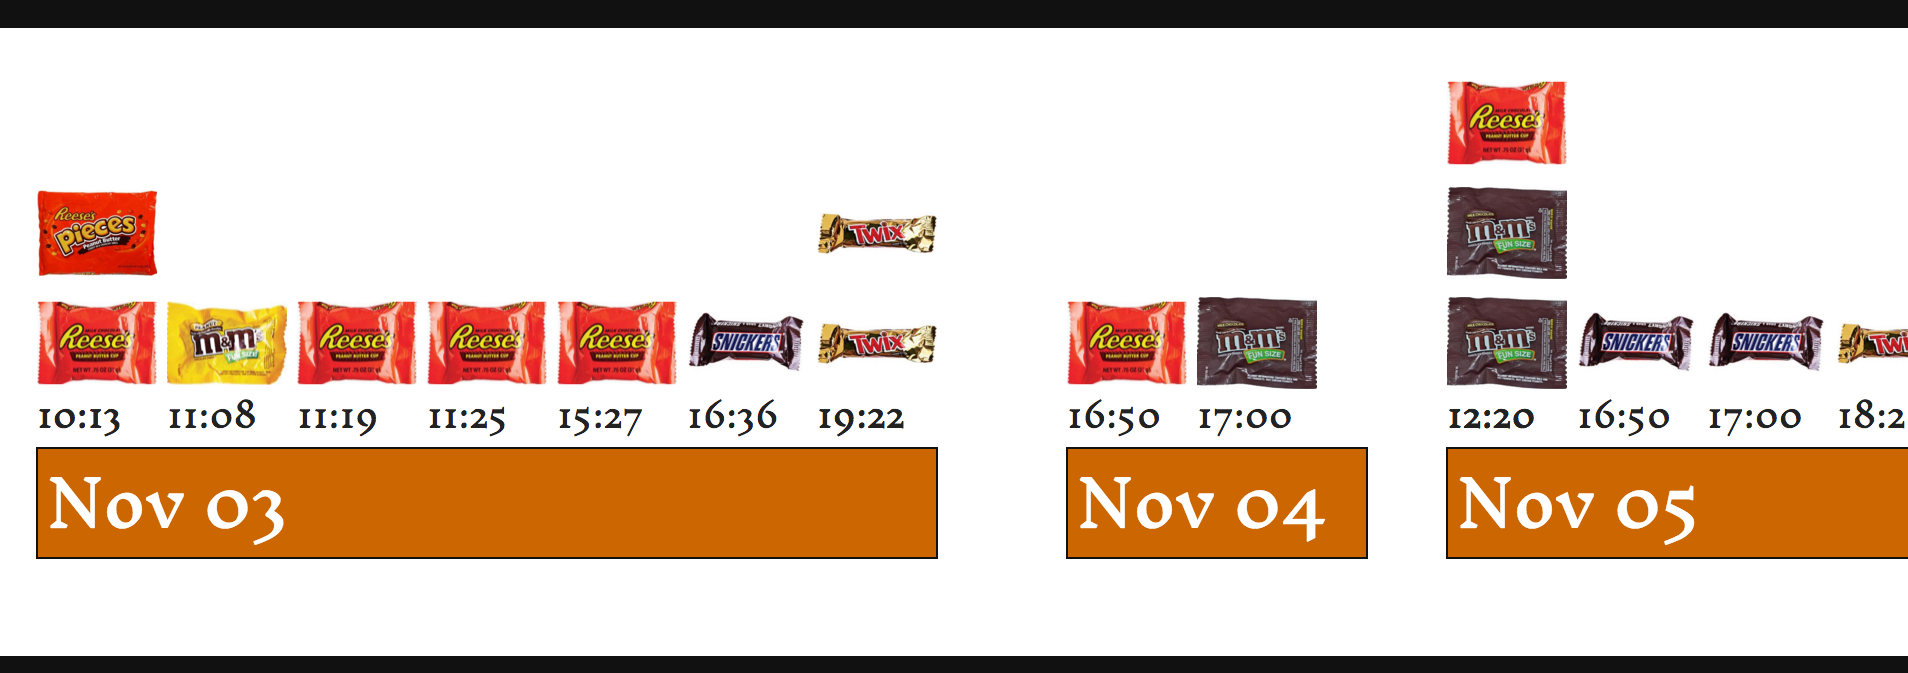
This visualization will show each day, and within each day it will show the time period that I had candy, and an image of the candy will designate what kind of candy, and how many at that time period.
D3 code
This uses the exact same data file as the previous chart, data/track-n-treat.json, but we build it in an entirely different way. We’ll also spice it up with some images.
Begin the HTML document
We start this file much like the previous.
<!DOCTYPE html>
<<span class="pl-ent">html</span> <span class="pl-e">lang</span>=<span class="pl-s"><span class="pl-pds">'</span>en<span class="pl-pds">'</span></span>>
    <<span class="pl-ent">head</span>>
        <<span class="pl-ent">meta</span> <span class="pl-e">charset</span>=<span class="pl-s"><span class="pl-pds">'</span>utf-8<span class="pl-pds">'</span></span>>
        <<span class="pl-ent">title</span>>Track-n-Treat</<span class="pl-ent">title</span>>
        <<span class="pl-ent">link</span> <span class="pl-e">href</span>=<span class="pl-s"><span class="pl-pds">'</span>styles.css<span class="pl-pds">'</span></span> <span class="pl-e">rel</span>=<span class="pl-s"><span class="pl-pds">'</span>stylesheet<span class="pl-pds">'</span></span> <span class="pl-e">type</span>=<span class="pl-s"><span class="pl-pds">'</span>text/css<span class="pl-pds">'</span></span> />
        <<span class="pl-ent">link</span> <span class="pl-e">href</span>=<span class="pl-s"><span class="pl-pds">'</span>https://fonts.googleapis.com/css?family=Inknut+Antiqua<span class="pl-pds">'</span></span> <span class="pl-e">rel</span>=<span class="pl-s"><span class="pl-pds">'</span>stylesheet<span class="pl-pds">'</span></span> <span class="pl-e">type</span>=<span class="pl-s"><span class="pl-pds">'</span>text/css<span class="pl-pds">'</span></span>>
<span class="pl-s1">        <<span class="pl-ent">script</span> <span class="pl-e">type</span>=<span class="pl-s"><span class="pl-pds">'</span>text/javascript<span class="pl-pds">'</span></span> <span class="pl-e">src</span>=<span class="pl-s"><span class="pl-pds">'</span>d3/d3.v3.js<span class="pl-pds">'</span></span>></<span class="pl-ent">script</span>></span>
    </<span class="pl-ent">head</span>>
    <<span class="pl-ent">body</span>>
      <<span class="pl-ent">h1</span>>Track-n-Treat 2015</<span class="pl-ent">h1</span>>
      <<span class="pl-ent">p</span>>Tracking how many candies I ate in the week after Halloween.</<span class="pl-ent">p</span>>

      <<span class="pl-ent">div</span> <span class="pl-e">id</span>=<span class="pl-s"><span class="pl-pds">'</span>wrapper<span class="pl-pds">'</span></span>>
        <<span class="pl-ent">div</span> <span class="pl-e">id</span>=<span class="pl-s"><span class="pl-pds">'</span>chart<span class="pl-pds">'</span></span>></<span class="pl-ent">div</span>>
      </<span class="pl-ent">div</span>>
A new line here that wasn’t in the previous document is the ‘link’ tag pulling in a Google font. We’ll add that as the default font, to give the text a more Halloweeny look.
The two HTML div tags are what the svg will be attached to. Having them allows the svg to scroll because the graph will be longer horizontally than the screen.
Begin the JavaScript and D3
We start the JavaScript and D3 code the same way as before.
<span class="pl-s1"><<span class="pl-ent">script</span> <span class="pl-e">type</span>=<span class="pl-s"><span class="pl-pds">'</span>text/javascript<span class="pl-pds">'</span></span>></span>
<span class="pl-s1">  <span class="pl-smi">d3</span>.<span class="pl-en">json</span>(<span class="pl-s"><span class="pl-pds">'</span>data/track-n-treat.json<span class="pl-pds">'</span></span>, <span class="pl-k">function</span>(<span class="pl-smi">data</span>) {</span>
<span class="pl-s1">    <span class="pl-k">var</span> w <span class="pl-k">=</span> <span class="pl-c1">2500</span>;</span>
<span class="pl-s1">    <span class="pl-k">var</span> h <span class="pl-k">=</span> <span class="pl-c1">300</span>;</span>

<span class="pl-s1">    <span class="pl-k">var</span> barW <span class="pl-k">=</span> <span class="pl-c1">60</span>;</span>
<span class="pl-s1">    <span class="pl-k">var</span> barH <span class="pl-k">=</span> <span class="pl-c1">55</span>;</span>
We start with the d3 method to pull in the json file. This includes a function that surrounds the rest of the d3 code.
We also set an arbitrary width and height. We’ll use these variables later for the dimensions of the main svg element. We also set the width and height that will be used as a representation of a candy bar.
Massaging the data
We need to nest the data, and group the candy by day and time. We’ll use the d3 ‘nest’ method and set the new array to the variable ‘nested’
For more help on understanding nesting see: http://bl.ocks.org/shancarter/raw/4748131/
Nesting our data will reformat the array from looking like this:
 [
   {<span class="pl-s"><span class="pl-pds">'</span>day<span class="pl-pds">'</span></span><span class="pl-k">:</span> <span class="pl-s"><span class="pl-pds">'</span>2015-11-01<span class="pl-pds">'</span></span>, <span class="pl-s"><span class="pl-pds">'</span>time<span class="pl-pds">'</span></span><span class="pl-k">:</span> <span class="pl-s"><span class="pl-pds">'</span>17:25<span class="pl-pds">'</span></span>, <span class="pl-s"><span class="pl-pds">'</span>candy<span class="pl-pds">'</span></span><span class="pl-k">:</span> <span class="pl-s"><span class="pl-pds">'</span>Heath Bar<span class="pl-pds">'</span></span>},
   {<span class="pl-s"><span class="pl-pds">'</span>day<span class="pl-pds">'</span></span><span class="pl-k">:</span> <span class="pl-s"><span class="pl-pds">'</span>2015-11-01<span class="pl-pds">'</span></span>, <span class="pl-s"><span class="pl-pds">'</span>time<span class="pl-pds">'</span></span><span class="pl-k">:</span> <span class="pl-s"><span class="pl-pds">'</span>17:25<span class="pl-pds">'</span></span>, <span class="pl-s"><span class="pl-pds">'</span>candy<span class="pl-pds">'</span></span><span class="pl-k">:</span> <span class="pl-s"><span class="pl-pds">'</span>Kitkat Bar<span class="pl-pds">'</span></span>},
   {<span class="pl-s"><span class="pl-pds">'</span>day<span class="pl-pds">'</span></span><span class="pl-k">:</span> <span class="pl-s"><span class="pl-pds">'</span>2015-11-01<span class="pl-pds">'</span></span>, <span class="pl-s"><span class="pl-pds">'</span>time<span class="pl-pds">'</span></span><span class="pl-k">:</span> <span class="pl-s"><span class="pl-pds">'</span>20:25<span class="pl-pds">'</span></span>, <span class="pl-s"><span class="pl-pds">'</span>candy<span class="pl-pds">'</span></span><span class="pl-k">:</span> <span class="pl-s"><span class="pl-pds">'</span>Kitkat Bar<span class="pl-pds">'</span></span>},
   {<span class="pl-s"><span class="pl-pds">'</span>day<span class="pl-pds">'</span></span><span class="pl-k">:</span> <span class="pl-s"><span class="pl-pds">'</span>2015-11-02<span class="pl-pds">'</span></span>, <span class="pl-s"><span class="pl-pds">'</span>time<span class="pl-pds">'</span></span><span class="pl-k">:</span> <span class="pl-s"><span class="pl-pds">'</span>17:38<span class="pl-pds">'</span></span>, <span class="pl-s"><span class="pl-pds">'</span>candy<span class="pl-pds">'</span></span><span class="pl-k">:</span> <span class="pl-s"><span class="pl-pds">'</span>Whopper<span class="pl-pds">'</span></span>},
   <span class="pl-k">...</span>
 ]
To look like this:
 [
   { <span class="pl-s"><span class="pl-pds">'</span>key<span class="pl-pds">'</span></span><span class="pl-k">:</span> <span class="pl-s"><span class="pl-pds">'</span>2015-11-01<span class="pl-pds">'</span></span>,
     <span class="pl-s"><span class="pl-pds">'</span>values<span class="pl-pds">'</span></span><span class="pl-k">:</span> [
                 {<span class="pl-s"><span class="pl-pds">'</span>key<span class="pl-pds">'</span></span><span class="pl-k">:</span> <span class="pl-s"><span class="pl-pds">'</span>17:25<span class="pl-pds">'</span></span>,
                  <span class="pl-s"><span class="pl-pds">'</span>values<span class="pl-pds">'</span></span><span class="pl-k">:</span> [
                              {<span class="pl-s"><span class="pl-pds">'</span>candy<span class="pl-pds">'</span></span><span class="pl-k">:</span> <span class="pl-s"><span class="pl-pds">'</span>Heath Bar<span class="pl-pds">'</span></span>, <span class="pl-s"><span class="pl-pds">'</span>day<span class="pl-pds">'</span></span><span class="pl-k">:</span> <span class="pl-s"><span class="pl-pds">'</span>2015-11-01<span class="pl-pds">'</span></span>, <span class="pl-s"><span class="pl-pds">'</span>time<span class="pl-pds">'</span></span><span class="pl-k">:</span> <span class="pl-s"><span class="pl-pds">'</span>17:25<span class="pl-pds">'</span></span>},
                              {<span class="pl-s"><span class="pl-pds">'</span>candy<span class="pl-pds">'</span></span><span class="pl-k">:</span> <span class="pl-s"><span class="pl-pds">'</span>Kitkat Bar<span class="pl-pds">'</span></span>, <span class="pl-s"><span class="pl-pds">'</span>day<span class="pl-pds">'</span></span><span class="pl-k">:</span> <span class="pl-s"><span class="pl-pds">'</span>2015-11-01<span class="pl-pds">'</span></span>, <span class="pl-s"><span class="pl-pds">'</span>time<span class="pl-pds">'</span></span><span class="pl-k">:</span> <span class="pl-s"><span class="pl-pds">'</span>17:25<span class="pl-pds">'</span></span>}
                            ]
                 },
                 {<span class="pl-s"><span class="pl-pds">'</span>key<span class="pl-pds">'</span></span><span class="pl-k">:</span> <span class="pl-s"><span class="pl-pds">'</span>20:25<span class="pl-pds">'</span></span>,
                  <span class="pl-s"><span class="pl-pds">'</span>values<span class="pl-pds">'</span></span><span class="pl-k">:</span> [
                              {<span class="pl-s"><span class="pl-pds">'</span>candy<span class="pl-pds">'</span></span><span class="pl-k">:</span> <span class="pl-s"><span class="pl-pds">'</span>Kitkat Bar<span class="pl-pds">'</span></span>, <span class="pl-s"><span class="pl-pds">'</span>day<span class="pl-pds">'</span></span><span class="pl-k">:</span> <span class="pl-s"><span class="pl-pds">'</span>2015-11-01<span class="pl-pds">'</span></span>, <span class="pl-s"><span class="pl-pds">'</span>time<span class="pl-pds">'</span></span><span class="pl-k">:</span> <span class="pl-s"><span class="pl-pds">'</span>20:25<span class="pl-pds">'</span></span>}
                            ]
                 }
               ]
   },
   {<span class="pl-s"><span class="pl-pds">'</span>key<span class="pl-pds">'</span></span><span class="pl-k">:</span> <span class="pl-s"><span class="pl-pds">'</span>2015-11-02<span class="pl-pds">'</span></span>,
    <span class="pl-s"><span class="pl-pds">'</span>values<span class="pl-pds">'</span></span><span class="pl-k">:</span> [
                {<span class="pl-s"><span class="pl-pds">'</span>key<span class="pl-pds">'</span></span><span class="pl-k">:</span> <span class="pl-s"><span class="pl-pds">'</span>17:38<span class="pl-pds">'</span></span>,
                 <span class="pl-s"><span class="pl-pds">'</span>values<span class="pl-pds">'</span></span><span class="pl-k">:</span> [
                            {<span class="pl-s"><span class="pl-pds">'</span>candy<span class="pl-pds">'</span></span><span class="pl-k">:</span> <span class="pl-s"><span class="pl-pds">'</span>Whopper<span class="pl-pds">'</span></span>, <span class="pl-s"><span class="pl-pds">'</span>day<span class="pl-pds">'</span></span><span class="pl-k">:</span> <span class="pl-s"><span class="pl-pds">'</span>2015-11-02<span class="pl-pds">'</span></span>, <span class="pl-s"><span class="pl-pds">'</span>time<span class="pl-pds">'</span></span><span class="pl-k">:</span> <span class="pl-s"><span class="pl-pds">'</span>17:38<span class="pl-pds">'</span></span>}
                           ]
                }
              ]
   }
   <span class="pl-k">...</span>
 ]
Here is the code to do that:
<span class="pl-k">var</span> nested <span class="pl-k">=</span> <span class="pl-smi">d3</span>.<span class="pl-en">nest</span>()
    .<span class="pl-en">key</span>(<span class="pl-k">function</span>(<span class="pl-smi">d</span>) { <span class="pl-k">return</span> <span class="pl-smi">d</span>.<span class="pl-smi">day</span>; })
    .<span class="pl-en">key</span>(<span class="pl-k">function</span>(<span class="pl-smi">t</span>) { <span class="pl-k">return</span> <span class="pl-smi">t</span>.<span class="pl-smi">time</span>; })
    .<span class="pl-en">entries</span>(data);
Basically, this makes a group of all the lines in the original array that have the same day. Then within that group, it makes a group for each time. It’s like an onion, with different layers of data.
Making the graph
<span class="pl-k">var</span> svg <span class="pl-k">=</span> <span class="pl-smi">d3</span>.<span class="pl-c1">select</span>(<span class="pl-s"><span class="pl-pds">'</span>#chart<span class="pl-pds">'</span></span>).<span class="pl-en">append</span>(<span class="pl-s"><span class="pl-pds">'</span>svg<span class="pl-pds">'</span></span>)
    .<span class="pl-en">attr</span>(<span class="pl-s"><span class="pl-pds">'</span>class<span class="pl-pds">'</span></span>, <span class="pl-s"><span class="pl-pds">'</span>graph<span class="pl-pds">'</span></span>)
    .<span class="pl-en">attr</span>(<span class="pl-s"><span class="pl-pds">'</span>width<span class="pl-pds">'</span></span>, w)
    .<span class="pl-en">attr</span>(<span class="pl-s"><span class="pl-pds">'</span>height<span class="pl-pds">'</span></span>, h)
  .<span class="pl-en">append</span>(<span class="pl-s"><span class="pl-pds">'</span>g<span class="pl-pds">'</span></span>)
    .<span class="pl-en">attr</span>(<span class="pl-s"><span class="pl-pds">'</span>transform<span class="pl-pds">'</span></span>, <span class="pl-s"><span class="pl-pds">'</span>translate(20,20)<span class="pl-pds">'</span></span>);
This creates the actual SVG canvas/element where the graph will be displayed. Select the div element with an id of ‘graph’, append an svg tag/element, give it a CSS class of ‘graph’, and set the width to the ‘w’ variable and the height to the ‘h’ variable as we assigned above.
Finally, append a group tag/element. This group is offset 20 pixels down and 20 pixels over from the original origin point. To better understand transform and translate read the section on SVG Transform as a Coordinate Space Transformation athttps://www.dashingd3js.com/svg-group-element-and-d3js
The 20 pixels down and over are for padding, especially useful if there are axis lines and markers. We don’t have axes in this visualization, but the padding is still useful.
Doing it old school
This is where all of the magic really happens. The data is used to place the points on the graph, create the bars, etc. Instead of using built in d3 functions for looping through the data, we’ll use default JavaScript control structures, the forEach loop.
First we’ll assign a default x position. This will determine the first position on the x-axis, which should start at 0.
<span class="pl-k">var</span> xPos <span class="pl-k">=</span> <span class="pl-c1">0</span>;
Let’s also declare some variables that we’ll use later.
<span class="pl-k">var</span> prevDayTime, thisDayTime, thisDay, prevDay;
Loop the loop
Next we’ll do a series of loops through the data, each loop associated with the groups created in the nested array that was created above.
The first level is the day object. The JavaScript ‘forEach’ is a relatively new built in function specifically for iterating over arrays.
The first time through ‘forEach’ returns an object where the ‘key’ is the date and the ‘values’ is an array of objects.
In the second ‘forEach’, we go through the ‘values’ of the first level. This returns an object, where the ‘key’ is the time and the ‘values’ is an array of objects that contain the date, time and candy.
Next, the third ‘forEach’ of the levelTwo ‘values’ array gives us each instance when the candy was eaten.
Here is the basic structure of the ‘forEach’ loops. We’ll add more code in the next steps.
<span class="pl-smi">nested</span>.<span class="pl-en">forEach</span>(<span class="pl-k">function</span>(<span class="pl-smi">dayObject</span>) {
    <span class="pl-smi">dayObject</span>.<span class="pl-smi">values</span>.<span class="pl-en">forEach</span>(<span class="pl-k">function</span>(<span class="pl-smi">timeObject</span>, <span class="pl-smi">dayIndex</span>) {
        <span class="pl-smi">timeObject</span>.<span class="pl-smi">values</span>.<span class="pl-en">forEach</span>(<span class="pl-k">function</span>(<span class="pl-smi">candyObject</span>, <span class="pl-smi">timeIndex</span>) {
        });
    });
});
In the function section of the last two ‘forEach’ methods, we create an object and an index. The ‘index’ for each of these is the index number of the array element. For the last ‘forEach’, the ‘candyObject’ contains the day, time and candy.
Making the graph
The first thing we’ll need to do is create an svg group element to contain each day.
<span class="pl-smi">nested</span>.<span class="pl-en">forEach</span>(<span class="pl-k">function</span>(<span class="pl-smi">dayObject</span>) {
    dayGroup <span class="pl-k">=</span> <span class="pl-smi">svg</span>.<span class="pl-en">append</span>(<span class="pl-s"><span class="pl-pds">'</span>g<span class="pl-pds">'</span></span>);

  <span class="pl-smi">dayObject</span>.<span class="pl-smi">values</span>.<span class="pl-en">forEach</span>(<span class="pl-k">function</span>(<span class="pl-smi">timeObject</span>, <span class="pl-smi">dayIndex</span>) {
    <span class="pl-smi">timeObject</span>.<span class="pl-smi">values</span>.<span class="pl-en">forEach</span>(<span class="pl-k">function</span>(<span class="pl-smi">candyObject</span>, <span class="pl-smi">timeIndex</span>) {
Then we need to pull some information from that specific instance of eating a candy. We need the day and the day and time together. We don’t need to declare these variables with var because we did that already above.
      thisDayTime <span class="pl-k">=</span> <span class="pl-smi">candyObject</span>.<span class="pl-smi">day</span> <span class="pl-k">+</span><span class="pl-s"><span class="pl-pds">'</span> <span class="pl-pds">'</span></span><span class="pl-k">+</span> <span class="pl-smi">candyObject</span>.<span class="pl-smi">time</span>;
      thisDay <span class="pl-k">=</span> <span class="pl-smi">candyObject</span>.<span class="pl-smi">day</span>
As we loop through each of the instances, we’ll need to check several things.
-
Is this the last instance at this time?
-
Is this the last instance for this day?
-
Is this the same time and day, but a separate instance? (Sometimes I had two or three candy bars within the same minute, ziggy-piggy.)
If the current day and time is the same as the previous day and time, then the x position should be the same. Later in the code we add 25 to the current x position, so that the next time through the loop, the x position of the box is further away from previous box. If it’s the same time and day, then we subtract that 25 we add on later to put it back to the same position as the previous time.
      <span class="pl-k">if</span> (thisDayTime <span class="pl-k">===</span> prevDayTime) {
        xPos <span class="pl-k">=</span> xPos <span class="pl-k">-</span> barW <span class="pl-k">-</span> <span class="pl-c1">5</span>;
      }
The candy man cometh
Next we start creating the candy elements of the graph. We could use boring bars and boxes, or we could use images of actual fun size candy bars and those yummy fun size packets of M&M’s and Reese’s Pieces.
We can do this by appending an image to the dayGroup svg group element we created before.
<span class="pl-smi">dayGroup</span>.<span class="pl-en">append</span>(<span class="pl-s"><span class="pl-pds">'</span>image<span class="pl-pds">'</span></span>)
    .<span class="pl-en">attr</span>(<span class="pl-s"><span class="pl-pds">'</span>xlink:href<span class="pl-pds">'</span></span>, <span class="pl-s"><span class="pl-pds">'</span>images/<span class="pl-pds">'</span></span> <span class="pl-k">+</span> <span class="pl-smi">candyObject</span>.<span class="pl-smi">candy</span> <span class="pl-k">+</span> <span class="pl-s"><span class="pl-pds">'</span>.jpg<span class="pl-pds">'</span></span>)
    .<span class="pl-en">attr</span>(<span class="pl-s"><span class="pl-pds">'</span>class<span class="pl-pds">'</span></span>, <span class="pl-s"><span class="pl-pds">'</span>bar<span class="pl-pds">'</span></span>)
    .<span class="pl-en">attr</span>(<span class="pl-s"><span class="pl-pds">'</span>x<span class="pl-pds">'</span></span>, xPos)
    .<span class="pl-en">attr</span>(<span class="pl-s"><span class="pl-pds">'</span>y<span class="pl-pds">'</span></span>, h <span class="pl-k">-</span> (barH <span class="pl-k">*</span> timeIndex <span class="pl-k">+</span> <span class="pl-c1">190</span>))
    .<span class="pl-en">attr</span>(<span class="pl-s"><span class="pl-pds">'</span>width<span class="pl-pds">'</span></span>, barW)
    .<span class="pl-en">attr</span>(<span class="pl-s"><span class="pl-pds">'</span>height<span class="pl-pds">'</span></span>, barH);
The first .attr tells d3 where to find the image to use; the xlink:href states there is a path to follow. The next part is the path to the image. We use the name of the candy supplied from the candyObject object. All of the image files have the same name as those used in the data (the json file), so each different candy can use the specific image for that candy. SocandyObject.candy returns ‘Kitkat’, or ‘Snickers’ or ‘Twix’, etc. The + plus signs in the code combine the string parts (those within the single quotes) with the variable.
All of the jpg files are in the ‘images’ directory, which is in the same directory where this file is.
Next, assign the svg element a class of ‘bar’ so we can style it if we need to.
The x position is dealt with elsewhere. The first time through the loop, for the very first instance, it is zero. Subsequent instances have an increased x position, or the same x position if the time is the same as the previous time.
The next bit of trickery is where to place the image vertically. Remember the y axis starts from the top of the screen, so we set the y location of the candy bar box to start at the highest value of the height (so it starts at the bottom of the screen), then subtract from that value to move the box up the screen. Some time periods have multiple candies (I ate two or three within one minute), so their x position is the same, but the y position needs to be higher.
To do this we’ll use the array’s index number to provide a variable in a made up formula for increasing the height. We want the stacked candy boxes to start at a specific point, lets say 190 pixels above the bottom of the svg ‘canvas’ that we create. The first candy for a time will then start at ‘400 - (35 * 1 + 190)’. That means starting at the bottom of the screen ‘400’, we’ll subtract 190, so half way up the canvas, plus move it up 35 for some padding. Halfway up the canvas gives us room for the times and date bars. Subsequent candy boxes will be bumped up ‘35 * 2’ or ‘35 * 3’ providing a stacked look.
Play with the numbers to see how the boxes move up or down.
Time for some labels
We need to add the time that each candy was eaten. We do this in a similar manner as adding the candy images, but appending text rather than images.
<span class="pl-smi">dayGroup</span>.<span class="pl-en">append</span>(<span class="pl-s"><span class="pl-pds">'</span>text<span class="pl-pds">'</span></span>)
   .<span class="pl-en">attr</span>(<span class="pl-s"><span class="pl-pds">'</span>class<span class="pl-pds">'</span></span>, <span class="pl-s"><span class="pl-pds">'</span>time<span class="pl-pds">'</span></span>)
   .<span class="pl-c1">text</span>(<span class="pl-smi">candyObject</span>.<span class="pl-smi">time</span>)
   .<span class="pl-en">attr</span>(<span class="pl-s"><span class="pl-pds">'</span>x<span class="pl-pds">'</span></span>, xPos)
   .<span class="pl-en">attr</span>(<span class="pl-s"><span class="pl-pds">'</span>y<span class="pl-pds">'</span></span>, h <span class="pl-k">-</span> (barW <span class="pl-k">*</span> <span class="pl-c1">2</span>))
   .<span class="pl-en">attr</span>(<span class="pl-s"><span class="pl-pds">'</span>width<span class="pl-pds">'</span></span>, barW)
   .<span class="pl-en">attr</span>(<span class="pl-s"><span class="pl-pds">'</span>height<span class="pl-pds">'</span></span>, barH);
This is very similar to the above. We append a text element to the dayGroup element we created before. The .text line is where we add the text. The text is just the time, which we can get from the candyObject.
candyObject = {'day': '2015-11-xx', 'time': 'xx:xx', 'candy': 'Xxxx'}
Each candyObject object has this info associated with it. The x’s in the example above are replaced each time it goes through the loop.
The x position, xPos, is set and the same as the candy wrapper image.
The y position will be the same for each time period. We’ll set it initially at the height of the ‘canvas’, so it starts at the very bottom. Then we’ll subtract some amounts to get it to a good spot. We can use the width variable for a set number, and then let’s multiply that by 2 for fun. We could have just used a static number, like ‘100’, but this way the height adjusts to any changes in the other aspects of the graph. If we change how big the candy bar wrappers are, then the time labels automatically adjust.
Play around with those numbers, replace the ‘h’ and ‘barW’ with actual numbers.
A box for each day
We’re placing something on the screen for the candy wrapper image and the time each time we loop through. For the instances when there are multiple candies at the same time, there are actually multiple times overlayed. They are in the exact same place, so you only see the one. This won’t work for the boxes that represent the days. We only want one box.
One way to solve this is to only draw the day box the very first time an instance of that day comes up in our loop. This is where our thisDay and prevDay variables come into play. We can check the current date with the previous date. If the current date is the same as the prevDate variable, then it is the same day, so don’t draw a box. The only time thisDay will not equal prevDay is when thisDay’s instance is the next day.
Hmm, that’s really hard to explain, and this probably confuses more than clarifies.
<span class="pl-c">// add the day boxes</span>
<span class="pl-k">if</span> (thisDay <span class="pl-k">!==</span> prevDay) {
  <span class="pl-smi">dayGroup</span>.<span class="pl-en">append</span>(<span class="pl-s"><span class="pl-pds">'</span>rect<span class="pl-pds">'</span></span>)
     .<span class="pl-en">attr</span>(<span class="pl-s"><span class="pl-pds">'</span>class<span class="pl-pds">'</span></span>, <span class="pl-s"><span class="pl-pds">'</span>day<span class="pl-pds">'</span></span>)
     .<span class="pl-en">attr</span>(<span class="pl-s"><span class="pl-pds">'</span>x<span class="pl-pds">'</span></span>, xPos)
     .<span class="pl-en">attr</span>(<span class="pl-s"><span class="pl-pds">'</span>y<span class="pl-pds">'</span></span>, h <span class="pl-k">-</span> <span class="pl-c1">110</span>)
     .<span class="pl-en">attr</span>(<span class="pl-s"><span class="pl-pds">'</span>width<span class="pl-pds">'</span></span>, (<span class="pl-smi">dayObject</span>.<span class="pl-smi">values</span>.<span class="pl-c1">length</span> <span class="pl-k">*</span> barW <span class="pl-k">+</span> barW<span class="pl-k">/</span><span class="pl-c1">2</span>))
     .<span class="pl-en">attr</span>(<span class="pl-s"><span class="pl-pds">'</span>height<span class="pl-pds">'</span></span>, barH);
Here we append a rectangle to the dayGroup object, give it a CSS class, set the x position to xPos, and the y position to a set number. This time we took the lazy way and just subtracted a static number from the height.
The width is the tricky part here. We want the width of the bar to be the length of all of the time elements for that day. We can get the number of times for a day from the dayObject object. The key is the date, and the value is an array of times. So we can get the number of times in a day with dot notation and the array length method, dayObject.values.length. That gives us a single digit, so we need to multiply that by the width of the candy bar image, dayObject.values.length * barW. Then add some more for padding. We can dynamically get a number by using the candy bar image width divided by 2,barW/2. That gives us a number that approximates the width taken up by all of the time elements for a day.
Making the box is only half the job. We should add some text so we know which day it is that we are adding. Let’s use the month and day in the format ‘MMM DD’, so the month name using three letters, and the two digit day of the month.
  dateForm <span class="pl-k">=</span> <span class="pl-smi">d3</span>.<span class="pl-smi">time</span>.<span class="pl-en">format</span>(<span class="pl-s"><span class="pl-pds">'</span>%b %d<span class="pl-pds">'</span></span>)
  <span class="pl-smi">dayGroup</span>.<span class="pl-en">append</span>(<span class="pl-s"><span class="pl-pds">'</span>text<span class="pl-pds">'</span></span>)
     .<span class="pl-en">attr</span>(<span class="pl-s"><span class="pl-pds">'</span>class<span class="pl-pds">'</span></span>, <span class="pl-s"><span class="pl-pds">'</span>date<span class="pl-pds">'</span></span>)
     .<span class="pl-c1">text</span>(<span class="pl-en">dateForm</span>(<span class="pl-k">new</span> <span class="pl-en">Date</span>(thisDayTime)) )
     .<span class="pl-en">attr</span>(<span class="pl-s"><span class="pl-pds">'</span>x<span class="pl-pds">'</span></span>, xPos <span class="pl-k">+</span> <span class="pl-c1">5</span>)
     .<span class="pl-en">attr</span>(<span class="pl-s"><span class="pl-pds">'</span>y<span class="pl-pds">'</span></span>, h <span class="pl-k">-</span> barW <span class="pl-k">-</span> <span class="pl-c1">10</span>);
}
To get the date we’ll use d3’s default time formating method, d3.time.format.
dateForm = d3.time.format('%b %d') creates a function that will take a date object and return it in the format ‘Month ##’
.text( dateForm(new Date(thisDayTime)) )
From the inside out: thisDayTime is the year-month-day and time variable we create above.
We use Javascript’s new Date() function to return a string from the time.
Then we use the dateForm function we created to format the date the way we want.
Make a little buffer
If it’s the last time of the day, and the last candy for that time, add in a space bumper. Without it the days are squished together. This adds a visually appealing space between the days.
<span class="pl-k">if</span> ( ( dayIndex <span class="pl-k">==</span> (<span class="pl-smi">dayObject</span>.<span class="pl-smi">values</span>.<span class="pl-c1">length</span> <span class="pl-k">-</span> <span class="pl-c1">1</span>) ) <span class="pl-k">&&</span> ( timeIndex <span class="pl-k">==</span> (<span class="pl-smi">timeObject</span>.<span class="pl-smi">values</span>.<span class="pl-c1">length</span> <span class="pl-k">-</span><span class="pl-c1">1</span>) ))
{
  xPos <span class="pl-k">=</span> xPos <span class="pl-k">+</span> barW;
}
We use an if statement to check if it’s the last day and the last time for that day. If so we need to increase the x position by the width of the candy bar image. Otherwise it will be at the same position as the last time. We don’t need to add an actual svg element, just increase the x position for the next time through the loop.
Increment the incrementables
Finally, we need to increment the x position and set the prevDayTime variable to thisDayTime and the prevDay variable tothisDay.
xPos <span class="pl-k">=</span> xPos <span class="pl-k">+</span> barW <span class="pl-k">+</span> <span class="pl-c1">5</span>;
prevDayTime <span class="pl-k">=</span> thisDayTime;
prevDay <span class="pl-k">=</span> thisDay;
Finish it
Close off the forEach loops
      });
    });
  });
Close off the encompassing d3 function, and close off the HTML tags to finish of the file.
        });
      </<span class="pl-ent">script</span>>
  </<span class="pl-ent">body</span>>
</<span class="pl-ent">html</span>>
You can see the visualization here: http://mossiso.com/d3-instructions/day.html
And get the code without comments here: https://github.com/mossiso/track-n-treat/blob/master/day-no-comments.html